www.ras-online.com RAS | JUNI 2022 19
Marktplatz Deutschland
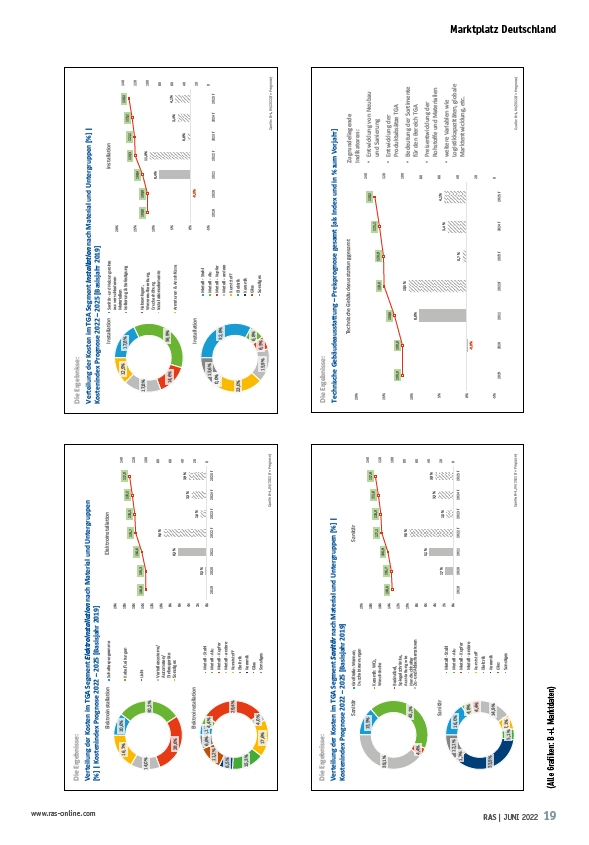
Die Ergebnisse:
Verteilung der Kosten im TGA Segment Elektroinstallation nach Material und Untergruppen
% | Kostenindex Prognose 2022 – 2025 Basisjahr 2019
Elektroinstallation
116,7 118,3 122,2
9,4 %
1,4 %
3,3 %
127,0
3,9 %
140
120
100
80
60
40
20
0
2019 2020 2021 2022 f 2023 f 2024 f 2025 f
Quelle: EUROSTAT-Erhebung, 03/2022
Elektroinstallation Schalterprogramme
10,6%
30,2%
16,7%
28,6%
14,0%
Kabel/Leitungen
Licht
Verteilersysteme/
Automaten/
Einbaugeräte
Sonstiges
Elektroinstallation
5,1%4,4%
29,4%
4,0%
6,6%
17,6%
11,2%
6,5%
15,3%
Metall - Stahl
Metall - Alu
Metall - Kupfer
Metall - andere
Kunststoff
Elektrik
Keramik
Glas
Sonstiges
100,0 100,3
0,3 %
106,6
6,3 %
20%
18%
16%
14%
12%
10%
8%
6%
4%
2%
0%
Die Ergebnisse:
Verteilung der Kosten im TGA Segment Sanitär nach Material und Untergruppen % |
Kostenindex Prognose 2022 – 2025 Basisjahr 2019
Sanitär
Quelle: B+L, 04/2022 (f = Prognose)
117,1 118,9 122,8
9,5 %
1,5 %
3,3 %
127,6
3,9 %
140
120
100
80
60
40
20
0
2019 2020 2021 2022 f 2023 f 2024 f 2025 f
Quelle: EUROSTAT-Erhebung, 03/2022
Quelle: B+L, 04/2022 (f = Prognose)
13,5%
Sanitär Großteile: Wannen,
43,1%
4,4%
39,1%
Duschabtrennungen
Keramik: WCs,
Waschtische
Badmöbel,
Spiegelschränke,
Ausstattung wie
Handtuchhalter
Zu- und Ablaufarmaturen
Sanitär
16,0%
4,8%
4,4%
14,9%
12,1%
5,1%7,1%
1,7%
33,9%
Metall - Stahl
Metall - Alu
Metall - Kupfer
Metall - andere
Kunststoff
Elektrik
Keramik
Glas
Sonstiges
100,0 101,7
1,7 %
106,9
5,1 %
20%
18%
16%
14%
12%
10%
8%
6%
4%
2%
0%
Preisentwicklung in der Gebäudetechnik | BTGA Pressekonferenz 04. Mai 2022 20 www.BL2020.com
Die Ergebnisse:
Verteilung der Kosten im TGA Segment Installation nach Material und Untergruppen % |
Kostenindex Prognose 2022 – 2025 Basisjahr 2019
Installation
120,3 121,1
11,0 %
0,6 %
125,1
3,4 %
130,2
4,1 %
140
120
100
80
60
40
20
0
2019 2020 2021 2022 f 2023 f 2024 f 2025 f
Quelle: EUROSTAT-Erhebung, 03/2022
Quelle: B+L, 04/2022 (f = Prognose)
Installation Sanitär- und Heizungsrohre
17,8%
17,8%
12,9%
14,6% 36,9%
aus verschiedenen
Materialien
Isolierung & Befestigung
Hebeanlagen,
Wasseraufbereitung,
Druckerhöhung
Installationselemente
Armaturen & Anschlüsse
Installation
32,8%
6,8%
13,6%
15,9% 6,3%
10,,70%%
23,0%
Metall - Stahl
Metall - Alu
Metall - Kupfer
Metall - andere
Kunststoff
Elektrik
Keramik
Glas
Sonstiges
100,0 100,0
-0,0%
108,4
8,4 %
20%
15%
10%
5%
0%
-5%
Preisentwicklung in der Gebäudetechnik | BTGA Pressekonferenz 04. Mai 2022 19 www.BL2020.com
Die Ergebnisse:
Technische Gebäudeausstattung – Preisprognose gesamt als Index und in % zum Vorjahr
Technische Gebäudeausstattung gesamt Zugrundeliegende
Indikatoren:
• Entwicklung von Neubau
und Sanierung
• Entwicklung der
Produktabsätze TGA
• Bedeutung der Sortimente
für den Bereich TGA
• Preisentwicklung der
Rohstoffe und Materialien
• weitere Variablen wie
Logistikkapazitäten, globale
Marktentwicklung, etc.
Quelle: EUROSTAT-Erhebung, 03/2022
Quelle: B+L, 04/2022 (f = Prognose)
100,0 100,0
-0,0%
108,6
8,6 %
120,0 120,9
10,5 %
0,7 %
125,1
3,4 %
130,2
4,1 %
140
120
100
80
60
40
20
0
20%
15%
10%
5%
0%
-5%
2019 2020 2021 2022 f 2023 f 2024 f 2025 f
Preisentwicklung in der Gebäudetechnik | BTGA Pressekonferenz 04. Mai 2022 21 www.BL2020.com
Preisentwicklung in der Gebäudetechnik | BTGA Pressekonferenz 04. Mai 2022 18 www.BL2020.com
(Alle Grafiken: B+L Marktdaten)
/www.BL2020.com
/www.BL2020.com
/www.BL2020.com
/www.BL2020.com